Vendor Outage Monitoring
Vendor outage monitoring is knowing when the external services your business depends on stop working, before your customers or your staff tell you.
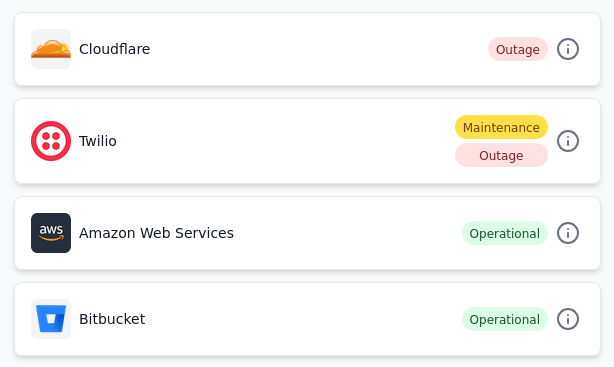
What Is Vendor Outage Monitoring?
Vendor outage monitoring is the practice of continuously tracking the operational health of third-party services an organization depends on, and getting that information to the people who need to act. The goal is simple: when a cloud region, SaaS product, payment processor, identity provider, or AI/LLM provider fails, the right people learn about it in time to triage, communicate, and recover without waiting for customers or staff to raise the alarm.
Vendor outage monitoring has three parts:
An updated inventory of the cloud, SaaS, and utility vendors that your business and teams depend on.
A reliable way to know when those dependencies break or degrade.
Alerting or notifications that are fast enough and precise enough that the signal reaches on-call engineers, support, and leadership while it still matters.
Some teams do it by refreshing a handful of browser tabs. Some build scrapers, webhooks, and internal dashboards. Some buy a vendor outage monitor that covers detection, filtering, alerts, and history in one place. The method can change with scale. The obligation stays the same: if the business cannot run without a vendor, someone has to watch that vendor.
Vendor outage monitoring is not the same as:
Monitoring your own infrastructure using uptime checks, APM tools, or log monitoring.
Answering annual vendor security questionnaires.
Risk reviews to check if a vendor looks responsible on paper.
Why Vendor Outages Became a Problem
Dependency Count Grew Faster Than Visibility
A modern organization rarely runs on a single stack. Compute and storage sit with cloud providers. Identity sits with a separate login vendor. Payments move through processors and banks. Staff talk on chat tools. Tickets live in a service desk. Builds run in CI. Content is served from a CDN. DNS is invisible but crucial. Underneath all of that are ISPs, mobile networks, and power grids. Each layer can fail independently of your application code.
Procurement, IT, and engineering often hold three different lists of those dependencies. New tools can be added through shadow IT. Previously retired tools may still be in the list. The result is a dependency surface that expands every quarter while the shared picture is often incomplete or informal.
Failure Is Now Mostly External
During an incident, the first useful question that teams struggle with is whether the failure is yours. Most teams have years of investment in answering that for their own code and infrastructure: metrics, traces, logs, synthetic monitoring, on-call runbooks. The same teams often have no answer for everything else. A payment form that fails, an application scale up that fails to scale, a connection failure to a remote service, or a deploy that cannot reach a registry can all look like internal defects until someone checks the vendor's status.
This gap shows up as wasted triage time - engineers dig through dashboards for a root cause that lives on someone else's status page. Support opens tickets, or customers escalate issues, while leadership asks for an ETA. Vendor outage detection exists to collapse this debate early by providing a single source of truth.
Vendor Dependencies Converge Into a Few Providers
Many vendors that look independent share the same upstream cloud providers, CDNs, identity providers, and DNS providers. When that upstream fails, several products downstream degrade as well. From the customer's viewpoint it looks like a string of unrelated SaaS outages. From an infrastructure viewpoint it is one incident with a wide blast radius.
Public write-ups of major cloud and SaaS events make the pattern concrete. The H1 2026 Cloud and SaaS reliability report and the 2025 Major Cloud Outages retrospective document how a small number of upstream failures repeatedly surface as multi-vendor outages. Concentration risk is the reason a single regional outage in a cloud provider can bring entire business operations to a halt.
Vendor Status Information Can Be Public but Scattered
Almost every significant vendor publishes status information: a status page, an RSS feed, an email list, a status bot in chat, an X account that posts during incidents. Almost none of that arrives where your team already works. The formats differ, the update latencies differ, and not all updates are relevant to your team.
Third-party outage monitoring is partly a collection problem. Someone has to pull those signals together, normalize them, and put them next to the services you actually run. Without that, the data exists in public and still fails operationally because nobody saw it in time.
The Cost of Finding Out Late
Late discovery has real costs to your business.
- Triage time gets used up in the wrong layer.
- Escalations can be duplicated across teams that do not realize they are looking at the same vendor outage.
- Support volume spikes while frontline staff lack a clear external cause.
- Planned maintenance windows get missed because nobody watched the calendar the vendor published.
- During renewal discussions, nobody has a clean record of how often the vendor slipped their SLA.
What Counts as a Vendor
Vendor outage monitoring is broader than watching famous cloud status pages. Anything outside your organization that must work for you to deliver service belongs in scope until you deliberately exclude it.
Banking and Fintech
Banks, lending platforms, and fintech APIs where downtime blocks money movement, KYC, or account access.
CDN, DNS and Edge Infrastructure
Content delivery, DNS, and edge networks that sit in front of almost every customer-facing path.
Cloud Providers
Regional and component-specific health for compute, storage, and other cloud services.
Communication and Collaboration
Chat, video, and workplace tools teams need to coordinate for work.
Consumer Platforms
Consumer-facing platforms your customers or partners use when engaging with your brand or services.
CRM, Marketing and Customer Support
CRM, marketing automation, and support desks that determine how you sell, retain, and help customers.
Crypto and Blockchain
Exchanges, wallets, and nodes infrastructure where availability is directly tied to transfers and settlement.
Cybersecurity
Security tooling, threat detection, and protective controls that protect your infrastructure and data.
Design
Design systems and creative tools that are critical for product and marketing delivery.
Developer Tools
CI, source control, artifact registries, and build platforms that make up any modern software development pipeline.
E-Commerce and Marketplaces
Storefronts, marketplaces, and commerce platforms where outages translate directly into lost revenue.
Education Technology Platforms
Learning platforms and edtech services that are used by students, teachers, and institutional operators.
Email Providers
Transactional and marketing email delivery that is critical for customer communication.
ERP and Business Systems
ERP and core business systems that keep finance, inventory, and operations synchronized.
Finance and Accounting
Accounting, invoicing, and financial tools that are critical for financial reporting and compliance.
Gaming and Entertainment
Gaming backends, streaming, and entertainment platforms with large concurrent audiences.
Geospatial and Location Data
Maps, geocoding, and location APIs embedded in logistics, retail, and mobile applications.
Government and Public Sector
Government portals and public-sector services where downtime blocks filings, benefits, permits, and citizen-facing workflows.
Healthcare
Clinical, scheduling, and health-data platforms where availability affects care and compliance.
Hosted Databases
Managed databases and data platforms that applications treat as always-on foundations.
HR and Workforce
HRIS, payroll, and workforce tools that staff need to get paid, scheduled, and onboarded.
Identity and Access Management
Login, SSO, and MFA providers that are gatekeepers for user authentication and access control.
Incident Management
On-call and incident platforms that are used to respond to incidents and manage the incident lifecycle.
IoT and Consumer Hardware
Device clouds and hardware backends that field equipment and consumer products depend on.
ISPs, Telcos, and Power Grids
Connectivity and power providers support almost every other dependency. Failures here often present as multi-application outages at a single site.
IT Operations and MSP Tools
RMM, PSA, and IT operations platforms MSPs and internal IT teams use to manage client environments.
Legal
Contract, e-signature, and legal workflow tools for closing deals and compliance tasks.
LLMs and AI Tools
Model APIs and AI platforms now embedded in developer tools, support flows, and internal tooling.
Logistics and Mobility
Shipping, fleet, and mobility platforms that keep goods and people moving on schedule.
Observability and Monitoring
Metrics, logs, and traces that are the foundation of observability and monitoring.
Payment Gateways
Processors and gateways for payment processing and revenue generation.
Property and Facilities
Building systems and facilities platforms for physical sites, retail floors, and workplaces.
You cannot monitor what nobody has written down. Procurement holds contracts. IT holds the SaaS admin list. Engineering holds the architecture diagram. Those three lists rarely match. A durable vendor outage monitoring practice starts by reconciling them, then deciding which dependencies warrant alerts, which warrant a dashboard glance, and which can stay out of scope until they earn a place.
How Vendor Outages Are Detected
Vendor outage detection is a collection of methods with different strengths, gaps, and latencies. Status page aggregation is one method inside vendor outage monitoring.
Official Status Pages
Official status pages are authoritative and often detailed at the component level. They can also lag behind the incident, because a human usually decides when to publish. Formats vary by vendor and can change without notice. Collecting and normalizing many pages into one view is its own problem, with parsers and feed formats that keep changing. Typical latency ranges from a few minutes to much longer when the vendor is slow to acknowledge. The acknowledgement lag is sometimes driven by the vendor's internal incident response process and policies.
Vendor Webhooks and APIs
Detection is faster and cleaner than scraping HTML when a vendor offers incident webhooks or a structured status API. Payloads arrive as events which can be processed in real-time. However, only some vendors expose a stable feed, and schemas can still drift. Webhooks can be a high-quality signal for the vendors that offer them but they are not a strategy that covers your whole stack.
Tenant-Scoped Health Feeds
Account-specific health endpoints and private status pages are specific to your tenant, region assignment, or workspace rather than the vendor's global presence. This level of accuracy is valuable because it provides outage information that is specific to your environment. Only some vendors expose this class of feed at all. The auth-gating also adds complexity if you are trying to build a unified view of all your dependencies, most of which have public status pages.
Synthetic Checks Against Vendor Endpoints
Synthetic probes can catch failures the vendor has not acknowledged yet, such as login pages that time out, APIs that return errors, and checkout flows that hang. They do not provide any information about the cause of the failure. A failed probe can be the vendor, your network path, a DNS resolver, or a false positive from rate limits. Synthetics can be used as an early hint, but they should be correlated with other signals before you confirm that it's an actual outage.
User and Community Reports
In practice, users and public outage communities are often the earliest signal. They are also noisy. A spike in complaints can mean a real outage or a local ISP issue. Such reports often do not provide enough information about which service is affected in a vendor that has many services or components.
Social and Official Communications Channels
Vendor communities (forums, Discord, Slack), status accounts on X and Bluesky, and support banners can also serve as indicators of an outage especially if the vendor does not have a status page. The information can be unstructured. These channels are best treated as corroboration for humans and not as the sole automated detection method.
Manual Checking
Opening status pages by hand still works for 3-5 vendors. Past that, it fails for ordinary reasons - people have to context-switch, and people cannot refresh thirty tabs every five minutes. Manual checking remains useful as a fallback during tooling outages. It is not a monitoring design for a realistic dependency list.
Combining Signals
No single method is sufficient. Official status pages remain the authoritative source of truth, since they are managed by vendors directly. They remain the contractually significant source for tracking SLAs and planned maintenance schedules. At the same time, they can lag the actual onset of the outage. Vendor delays in updating status pages can reflect their internal incident response process where they are still investigating the scope of the outage. These delays vary across vendors.
By themselves, the other methods are not sufficient either:
- Synthetics can generate false alarms.
- Community reports can overreact or point in completely wrong directions.
- Webhooks are not available for every vendor.
- Social and official communication channels are scattered across different platforms and require manual checking.
Augmenting the official status page with other signals can help to provide a more complete picture of the outage.
From Detection to Response
Detection can be delivered to the right people in multiple forms:
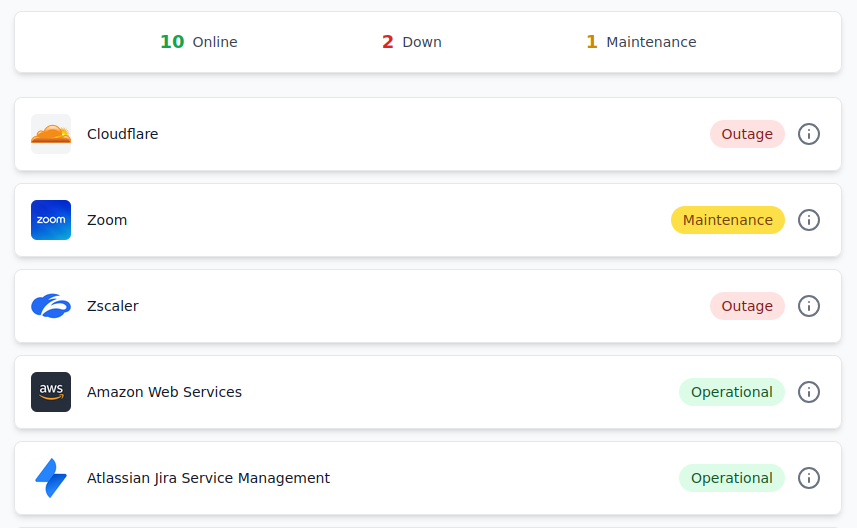
A single status page - the proverbial 'single pane of glass' showing you the overall status of all your vendors.
Alerts that are routed to your team's communication or incident response channels.
A Single Status Page
A vendor incident produces one question, asked repeatedly: 'Is something external down, or is it us?' The alert answers it for the people on the alert channel. Everyone else asks in a ticket, in Slack, or by walking over.
A single status page can answer it once, for the duration of the outage, and stay up afterwards for anyone checking what the current status is. It shows current status for every vendor and their components you monitor, an incident timeline filtered to the components you care about, and upcoming maintenance.
Where the page sits is something you can decide - the intranet homepage, a NOC screen, embedded in a client portal, or in the support autoresponder.
Alerts in Your Workflow
Most vendor incidents will not affect you. A storage issue in a region you don't run in, a maintenance window for a component you don't use, or an advisory for a SKU nobody bought. Unfiltered, this is a status page's RSS piped into Slack, and people start ignoring the channel when it gets too noisy.
Filtering by vendor, component, and incident type reduces noise. Alert lifecycle filtering based on the criticality of the component and the impact on your business fine tunes the alerts further.
Alert routing decides the rest: Slack or Teams for awareness, PagerDuty for the vendors that justify waking someone, Zendesk or Freshdesk to help your support team handle customer inquiries.
Where the Two Meet
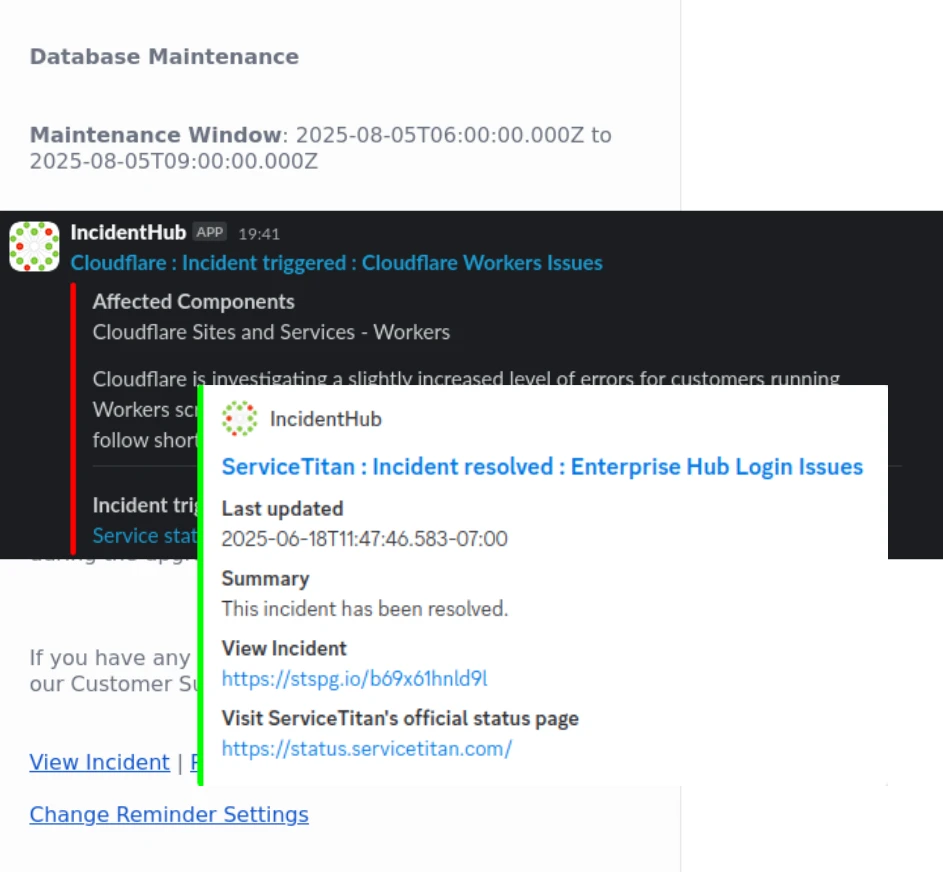
These two approaches present the same event in different ways.
Some vendors warrant both. Some warrant only a place to look, with nobody interrupted.
The Historical Record
Outage timelines per vendor and per component turn scattered status updates into something you can compare, export, and argue from. Historical uptime and incident trends answer a different question from the alert: how often has this vendor failed, and where. Historical trend data is filtered by the components you care about.
SLA credits are almost always claim-based and they have a window of validity. Claiming one needs timestamps you trust - when the incident started, which components were affected. Without that record, the contractual remedy is theoretical.
Renewals often need the same evidence. A vendor that marketed high availability reads differently next to your own incident history. Procurement wants dates, durations, and whether the failures affected production. Industry-wide analysis such as the AWS Outage and Reliability Report for 2025 explains the pattern. The same historical data can help in determining the move to another vendor or the next purchase when two vendors look identical on a feature matrix.
Patterns are hard to see from memory and obvious in a timeline. Do failures cluster after releases, on particular weekdays, in particular regions? Auditors ask a simpler question, which is whether outages were noticed and handled, and the same historical data answers that too.
Planned Disruption
Scheduled maintenance can still cause unintended disruption. It needs the same relevance filtering and routing as unplanned outages, because a maintenance window you ignore affects your business operations in the same way. Maintenance reminders exist so those windows show up in the channels people already watch. Guidance on planning around cloud maintenance is also covered in planning for upcoming cloud maintenance.
A useful practice is a rolling view of what is scheduled across everything you depend on for the next fortnight. Vendors announce on different cadences but a rolling view is still better than discovering downtime because of a maintenance window that was announced earlier, but nobody noticed.
Where It Sits Alongside Other Tooling
Vendor outage monitoring overlaps your existing tools without replacing them. Each row below states what the other tool does well.
Uptime and Synthetic Monitoring
Watches your services from the outside. It is excellent at telling you that your site or API failed a probe. It is complementary to vendor outage monitoring, not a substitute. A synthetic check can hint that a dependency is involved. It will not inventory your vendors or retain their incident history for you.
Observability and APM
Watches your code and infrastructure from the inside. Metrics, traces, and logs explain how your system is behaving. They tell you when something is failing. They do not, by themselves, announce that a vendor caused it. Correlation with external status makes observability faster. It does not replace external detection.
Incident Management and On-Call Platforms
Coordinate response: paging, timelines, roles, post-incident review. They assume someone already decided an incident exists. They do not detect external causes. Vendor outage monitoring feeds into those platforms and the data can be correlated with outages from your primary monitoring.
Third-Party Risk Management
Covers security posture, contracts, questionnaires, and periodic reviews. The buyer is often the risk or procurement department. The review cadence is quarterly or annual. A clean security questionnaire does not tell you the vendor was down at 02:00.
Crowdsourced Outage Sites
Offer broad consumer coverage and sometimes early buzz. They do not filter to your stack, do not notify your on-call, and rarely provide component detail you can act on. Useful as a secondary enrichment source. Weak as a primary operational feed.
Status Page Aggregation
One detection mechanism within vendor outage monitoring. It collects and normalizes published status information from many vendors. It does not, on its own, cover vendors without pages, or the full response loop.
| Category | What It Watches | Whose Systems | Typical Strength |
|---|---|---|---|
| Vendor Outage Monitoring | Vendor health and incidents | Third parties you depend on | Filtered alerts, history, unified status page |
| Uptime and Synthetic Monitoring | Your site and APIs | Yours, from the outside | Availability of what you run |
| Observability and APM | Metrics, traces, and logs | Yours, from the inside | Diagnosis of internal failure |
| Incident Management and On-Call Platforms | Declared incidents | Your response process | Coordination and paging |
| Third-Party Risk Management | Security posture, contracts, questionnaires | Vendors, periodically | Governance, not live ops |
| Crowdsourced Outage Sites | Broad consumer outage reports | Public consumer signal | Early buzz, secondary enrichment |
| Status Page Aggregation | Published vendor status pages | Vendors that have a status page | Official vendor signal, with possible lags |
Who Needs Vendor Outage Monitoring?
Different groups need to watch different vendors and make different decisions using the same underlying toolkit.
MSPs and IT Service Providers
Watch the vendors behind each client environment. The decision is which clients need a heads-up or a status update. Good here looks like per-client, isolated clarity without a manual refresh across every tenant's stack.
Internal IT and Service Desk
Watch the SaaS and connectivity tools employees use to do their jobs. The decision is whether to broadcast, open a major incident, or wait. Good looks like staff hearing a clear external cause before the ticket queue fills with helpdesk requests.
SRE and Platform Teams
Watch cloud, CI, artifact registries, identity, and the infrastructure dependencies under production. The decision is whether to investigate internally or mitigate around a vendor where possible. Good looks like 'is it us or them' answered in a few minutes.
Customer Support
Watch the vendors that change what customers experience: payments, auth, messaging, core product backends. The decision is what to tell the customer now. Good looks like consistent answers across agents because everyone saw the same external signal.
E-Commerce and Payments-Dependent Businesses
Watch processors, fraud tools, tax services, and storefront platforms. The decision is whether to pause campaigns, switch processors, or message shoppers. Good looks like revenue-impacting vendor events reaching commerce ops as fast as they reach engineering.
Procurement and Vendor Risk
Watch the reliability evidence that renewals and credits require. The decision is whether to renew, renegotiate, or exit. Good looks like incident history ready before the QBR, not reconstructed from chat logs the week before signing the contract.
Engineering Leadership
Watch concentration and recurring vendor pain across the portfolio. The decision is architecture and vendor selection. Good looks like reliability data influencing buy-versus-build and multi-vendor choices without waiting for a spectacular outage to force the conversation.
K-12 Admins
Watch the learning platforms, identity providers, and district SaaS tools classrooms depend on each day. The decision is whether to notify schools, pause online assessments, or wait. Good looks like principals and teachers hearing a clear external cause before users log duplicate tickets.
How To Choose a Vendor Outage Monitoring Solution
Build, Buy, or Manual
Manual monitoring is defensible at roughly 3-5 vendors when the same people already watch those status pages and the blast radius is small. It stops working when coverage grows, when people take leave, or when you need history and routing rather than a browser bookmark folder.
Building is defensible when your dependency set is unusual and nobody covers it, or when you have hard requirements around data residency and custom correlation. Budget ongoing maintenance explicitly. Vendor page formats change, feeds break, parsers can stop working silently. The TCO can be much higher than expected.
Buying fits when you want coverage, channels, filtering, and retention without staffing a permanent parsing project. Evaluate products as operational systems.
Evaluation Criteria
Headline counts matter less (thousands of vendors monitored but 2 from your stack are missing) than whether the services on your critical path are included.
Ask for turnaround time when a vendor in your stack is missing. A catalog that never grows is not a good fit.
Webhooks, tenant feeds, synthetics monitoring, and community correlation fill gaps that published status pages leave open.
Component, region, severity, and incident-type controls decide whether the tool continues to be useful.
Chat, email, paging, ticketing, and webhooks only help if they match how you work today. Nobody wants to install another tool just to get alerts.
Confirm how far back data goes and whether you can export it when you need to.
Private or account-specific health matters (e.g. Microsoft Azure, Microsoft 365, etc.) when a global page stays green.
SSO, roles, and an API determine whether the tool fits enterprise and automation needs.
Check whether adding vendors or people is penalized as you grow, or if it's flat-rate with no hidden costs.
Questions To Ask a Vendor
Signs It Is Not Working
Alert fatigue is the most common failure mode: too many low-relevance events, so people mute the channel. Alerts that nobody acts on are a process failure even when the feed is accurate. Vendors discovered missing during an outage mean the inventory is wrong. A status page that nobody looks at means it stopped being useful at some point.
Fix the inventory and the filters before you buy another tool.
Frequently Asked Questions
Get Started
See a live status view, read deeper operational write-ups, or start monitoring the vendors your organization already depends on.